Documenting Systemic Racism and Inequity in Quincy
A starting point for the Commission on Equity and Inclusion to continue further investigation on issues of racism and inequity in the city, in order to determine what actions can be taken to mitigate them
QFTC Organizer | December 10, 2021
Executive Summary
This report aims to provide an initial review of systemic racism and inequities within the city of Quincy, analyzed through five main categories: 1. City Government and Services, 2. Healthcare, 3. Housing, 4. Police and Criminal Justice, and 5. Schooling.
This report finds structural racism and inequities continue to exist throughout many, if not all, institutions and facets of life in Quincy.
- For City Government & Services, we found: Lack of investment in city-level Equity, Diversity, and Inclusion Initiatives; and a need for expanded accessibility to services
- For Healthcare, we found:Obstacles to healthcare access continue to exist in Quincy; there exists a need for culturally sensitive and equitable healthcare treatment; and food deserts exist in Quincy
- For Housing, we found: Quincy has a long history of structural racism connected with housing; Racial disparities in home ownership and household wealth exist throughout the Greater Boston area; and Quincy has a history of housing discrimination and tenant rights violations on the basis on protected characteristics
- For Policing, we found: Quincy Police Force’s demographics do not reflect its diverse population; Black residents have disproportionately high arrest rates
- For Schooling, we found: Quincy Public School’s staff demographics do not reflect the school system’s diverse student population; Racial inequities exist in Quincy Public School’s discipline rates; and the School District has struggled to address issues of racism regarding the former North Quincy High School’s mascot, the Yakoo.
This report is by no means comprehensive. Instead, it aims to be a starting point for the commission to continue further investigating issues of racism and inequity in Quincy. As a local grass-roots group, our work cannot compare to city-led data analysis and reports on these topics. We urge the city to take responsibility and lead these efforts against systemic racism and inequity.
Section 1: City Government & Services
Research Findings:
- Limited or lack of investment in city-level Equity, Diversity, and Inclusion Initiatives
- Equity, Diversity, and Inclusion initiatives are not mentioned in the City of Quincy’s FY22 budget or other prior year budgets (see Budgets here)
- A Need for Expanded Language Accessible Services
- Quincy has a large community that has limited English proficiency, with 20.35% of the population speaking English “less than very well”. The largest community speaking a language besides English is by far the Chinese speakers, comprising 17.8% of Quincy’s residents, with those speaking English “less than very well” making up 12.75% of the population. (source)
- Quincy previously released their Language Access Plan that includes increased outreach
- Given Quincy’s large population with limited English proficiency, continued analysis and growth is needed for language accessible services – in the city, schools, and more.
- There is an “Asian Office” with an Asian Liaison in Quincy government. (source) However, other minorities do not have equivalent liaison access, interpretation information, and referral to assistance programs.
To Look Into:
- What are the Language Access Plan’s successes and roadblocks to date?
- Do residents with Limited English Proficiency know that translation and interpretation services are available from the city? How can we increase outreach and accessibility?
- Is city government staff diverse? Is pay scale equitable among race and gender?
Action Points:
- Create and fund Equity, Diversity, and Inclusion initiatives for government, including liaison(s) for other minority races
- Increase outreach for Quincy’s Language Access Plans
Section 2: Health & Healthcare
Research Findings:
- Obstacles to Healthcare Access Continue to Exist in Quincy:
- In Quincy’s Medical Center Population Health Improvement Report from 2013, they identified several major concerns for their service area population. They are explored below:
- Focus groups identified underserved communities as returning veterans, Asian residents, the growing population of South Asian residents, single parent families, elderly, and a growing Portuguese-speaking community. Several identified obstacles to these underserved communities include language disparity, complex insurance processes, and transportation issues.
- Focus groups called for improved information sharing, as there was lack of knowledge on available health resources in the community.
- With these obstacles and the closure of the Quincy Medical Center, attention is needed on the health access and health outcomes of Quincy residents.
- Healthcare Access Issues for the Growing Quincy Asian Population.
- The City of Quincy has a relatively large Asian population (24%) compared to the state (5.3%) and neighboring towns. Focus group participants as well providers expressed concern that Asian residents experience barriers to regular care including difficulty with insurance enrollment requirements and availability of culturally-similar providers. (source)
- Minority populations tend to have higher rates of uninsured than whites. About 82% of Asian Americans had health insurance coverage in 2009 as compared to 88% of white Americans.
- Previously, only 5% of QMC patients were of Asian descent. This means a majority of Asians in the community were either not receiving the health care they need or were going outside the community for their care (source)
- The Need for Culturally Sensitive and Equitable Health Care Treatment
- Asian Americans were the only racial and ethnic group consistently screened less for Type II Diabetes. Asian patients at South Cove Community Health Center experience difficulty in receiving a Type II Diabetes diagnosis. Researchers theorize implicit bias plays a role in the diagnosis disparity and the high prevalence of undiagnosed diabetes in Asian Americans. (source).
- Cultural differences and language access issues can lead to various disparities in health and health access. For instance, it may affect the patients’ ability to recognize symptoms, to seek care, and to understand the healthcare services and processes (source).
- Health practitioners receive little to no training in working with diverse patient populations. In order to provide the same level of care, practitioners often have to spend extra time and effort addressing language difficulties and cultural differences. (source)
- Food Deserts Exist in Quincy, Preventing Access to Healthy Foods:
- Germantown, a neighborhood of Quincy, is about eight miles from the nearest supermarket, making it difficult for residents, especially elderly residents, residents with children, and residents without cars, to easily access food. This makes Germantown a food desert, i.e. a community lacking access to supermarkets or other sources of fresh, healthful food. (source)
To Look Into:
- Did closing Quincy Medical Center result in significantly increased healthcare barriers for marginalized races who may not have the resources or ability to travel out of town for healthcare, or access potentially more expensive or restricted care in Quincy?
- Conduct a survey on current access and barriers to healthcare in Quincy. Are community health centers meeting minorities' medical needs? Do they have disparities in health outcomes of patients of different races?
- What is the linguistic and cultural competency of the EMS personnel contracted by the City of Quincy, as well as other first responders from QFD and QPD?
- Are there disparities in COVID-19’s impact on different races? Does Quincy have vaccine equity?
Action Points:
- Assisting with medical outreach to underserved communities, especially with regard to cultural competency or language services (for example, Nina Liang’s multilingual COVID vaccine clinic for seniors in early 2021)
- Identify barriers for grocery store locations in Quincy’s food deserts, and what can be done (for instance, zoning changes).
Section 3: Housing
Research Findings:
- Quincy has a long history of structural racism connected with housing:
- White flight from Boston in the civil-rights era brought many Whites to suburbs, including Quincy, that had already established themselves as hostile to Black people through the restrictive mortgage and lending practice known as redlining (source). Quincy is also one of 17 likely “sundown” towns in Massachusetts, places where Black people were not allowed to stay after dark, out of threat of bodily safety (source).
- Most Quincy neighborhoods are environmental justice (EJ) communities, areas that have any of the following characteristics: low income, a high percentage of people of color, and a high rate of non-native English speakers (source). Some neighborhoods with two or more qualifying characteristics, like Germantown and Quincy Point, border the Fore River Basin, a longtime industrial site that houses a newly built natural gas compressor station. Even before the compressor station went in, these neighborhoods (source) had elevated rates (source) of heart attacks, chronic obstructive pulmonary disease hospitalizations, and lung cancers, all of which may be due to environmental pollution (source).
- Racial housing segregation continues to exist in Quincy.
- Quincy’s dissimilarity index, which is a commonly used segregation measure in the social sciences, is 41.0. This means, for racial segregation to not exist in Quincy, 41% of Quincy’s non-white population must move into another neighborhood. (source)
- Below is a chart of dissimilarity indices broken down by race and ethnic groups. From this, we can see, for instance, for White-Asian segregation to not exist, a little over 30% of Asians must move into another neighborhood.
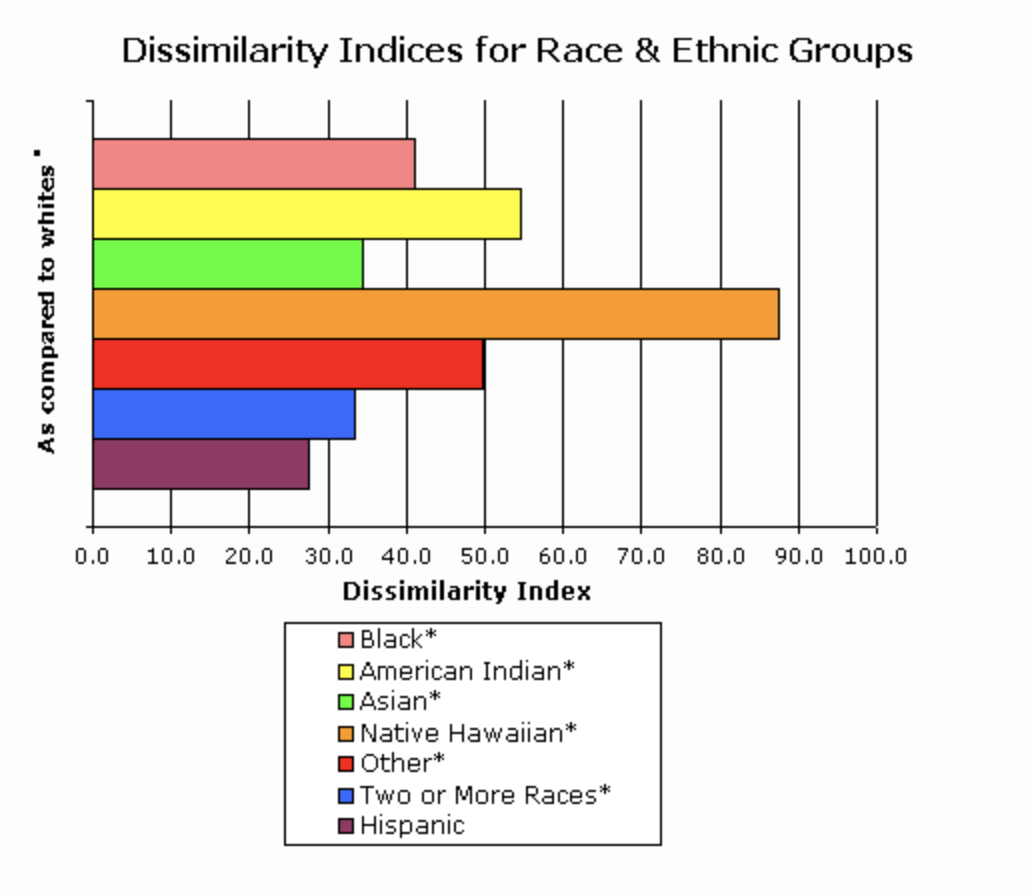
Caption: This image shows the dissimilarity indices for race and ethnic groups in Quincy.
Source: Census Scope for Q
- Racial disparities in home ownership and household wealth exist throughout Boston, Greater Boston, and Massachusetts
- In the now infamous 2015 study, the Federal Reserve Bank of Boston found for the Boston Metropolitan Statistical Area (which includes Quincy), close to 80% of white residents owned a home whereas only 30% of black residents owned a home. When disaggregated by ethnicity, Dominican and Puerto Rican black residents had even lower rates of home ownership. (source)
- These stark figures have implications for household wealth. While white households had a median wealth of $247,500, black households had a median wealth close to $0. (source)
- People of color have historically experienced lower homeownership rates, almost 20% lower than whites. (source )
- People of color are more likely to report racial discrimintation when trying to buy or rent a house. (source)
- These studies show how racial disparities in home ownership and wealth exist throughout Boston. We urge the city government to conduct their own research on this issue in Quincy, paying special attention to disaggregate racial and ethnic groups beyond Black and White (i.e. Caribbean Black, Chinese, etc).
- Quincy has a history of housing discrimination and tenant rights violations on the basis on protected characteristics (race, national origin, etc).
- From 2009 to 2014, 20 fair housing complaints from Quincy were filed with South Shore HOME Consortium on the grounds of race and disability, familial status, national origin, retaliation, religion, and color. Out of the South Shore towns of Braintree, Holbrook, Milton, Quincy, and Weymouth, Quincy had the highest number of complaints in this time period. (source)
To Look Into:
- Examine and analyze Quincy’s property records on the number of single family homes purchased, for example, in the past 5 years, by race/ethnicity.
- Examine and analyze public housing access data from Quincy Housing Authority data by race/ethnicity
- Conduct a study similar to the Federal Reserve Bank of Boston’s 2015 report to analyze household wealth by race/ethnicity.
- Explore access to opportunity by race through mapping opportunity indices used by HUD (i.e. poverty, school proficiency, labor market engagement, and neighborhood health)
Action Points:
- Ensure that funds from the Quincy affordable housing trust (from local developers' contributions), as well as federally funded community development block grants, are being equitably allocated to minority races' needs.
Section 4: Policing & The Criminal Justice System
Research Findings:
- Quincy Police Force’s demographics do not reflect its diverse population.
- White people make up 61% of the general population but 96% of the police force. Asian Americans account for 31% of the population but only 3% of the police force. Black people represent 5% of the population but 1% of the police force. Hispanic residents make up 3% of the population but 0.4% of the police force. Women make up 51% of the population but only 10% of the police force. (source)
- Black residents have disproportionately high arrest rates
- Despite making up only 5% of the population, Black people accounted for 26% of all arrests in Quincy in 2019.
To Look Into:
- What concrete changes have been implemented to improve hiring diversity in the police force?
- What is the distribution of incidents in the various Quincy neighborhoods compared to their demographics?
- Why is police spending per capita higher than most other comparable towns in MA? (source)
Action Points:
- Do a systematic survey (translated into all languages spoken in Quincy) to collect information on minority residents' experiences with the Quincy police. Figure out what trends or common threads are present, and what can be done to address them.
- One particular question of interest: how many people avoid the police or how many incidents go unreported because of perceived potential adverse outcomes from dealing with the police?
- Increase transparency and oversight over the police department’s accounting (see here)
Section 5: Schooling
Research Findings:
-
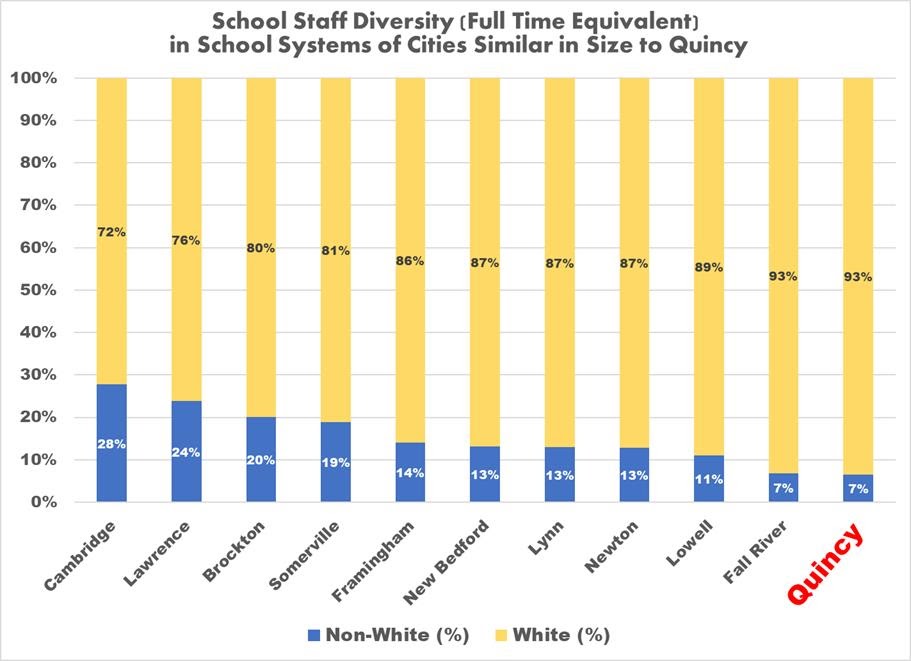
Quincy Public School Staff’s Demographics do not reflect the school system’s diverse student population.
- In the city’s public schools, 56% of Quincy students are non-White, while only 5% of teachers are. QPS staff is less diverse than the state, where on average 11% of school staff are people of color (source), and the country, where that figure is 20%. In fact, Quincy’s school staff is less diverse than every other city of a similar size in Massachusetts (source).
-
Caption: the figure above shows school staff diversity in 11 neighboring school systems of cities similar in size to Quincy. Quincy is last in the list. (source)
-
Racial inequities exist in Quincy Public School’s discipline rates.
- In Quincy’s schools, where Black students make up 7% of the student population, they accounted for 20% of all disciplinary incidents in the 2019-2020 school year, representing the largest group of students suspended. (source)
 In 2021, Weymouth High School, Quincy’s South West Middle School, Plymouth as a district, both Plymouth high schools, and Rockland High School were identified by the state and placed into a program for schools that suspend students of color or students with disabilities at a disproportionate rate. (source)
-
The long struggle to amend the former North Quincy High School’s mascot, the Yakoo.
- Yakoo originally depicted Armenian dentist and North Quincy High alumnus Dr. Allan Yacubian in “redface” caricature. The administration has fielded criticism of the racist nature of the mascot and calls to change it since the 1980s. The school was asked to remove the mascot in 1990 by the US Department of Education, but the school committee voted to keep it in 1993. In 1995, the Boston office of the Federal Civil Rights Office ruled the mascot “offensive”. (source) And yet, it wasn’t until 2020, amidst a renewed push to demand justice for marginalized races, that the mascot was updated to remove its harmful depiction of Native American stereotypes (source). Even so, the original racist caricature is still being used by many youth and alumni sports teams and groups today.
To Look Into:
- In the past year, QPS' Racial Climate Assessment was conducted through VISIONS - what are the results of that?
- Is there a nurse in every school every day? Does their diversity reflect the student body, and are they culturally competent?
- Perform a comprehensive survey and study on inclusion and anti-racism/hate speech to diagnose long-standing problems of racism and hate in the School District. See Monroe School District’s comprehensive report for an example.
- Request a full report from QPS on demographic data, and data on the rates and types of punishments (in and out of school suspensions) across the school system by race/ethnicity.
Action Points:
- Teachers in the QPS system have been submitting proposals for antiracist and restorative justice programs; these can potentially be implemented in schools.
- Increase transparency and clarity around school action plans regarding racist incidents (within and between students, faculty, staff, administration), and ensure administration follows through.
- Update school curriculum for increased representation, and take concrete steps to attract and hire more diverse staff.